Derailed or All Aboard? Keep an eye on the transportation index.
The Dow Jones Transportation Index has begun weakening off its highs. While earnings reports from companies such as CSX Corp (“CSX”) and Union Pacific (“UNP”) came in well, we saw their stocks fall off due to weaker forward guidance.
We’ve also seen mixed earnings from airliners such as Southwest “LUV”), United (“UAL”), and Delta (“DAL”) and subsequent moves in their stock prices reflect weak sentiment and weak forward guidance. Other components including shipping, ground transportation, and logistics have also weakened. The Moving Average Convergence Divergence (“MACD”), which historically has had a faster momentum signal has already flipped to the downside.
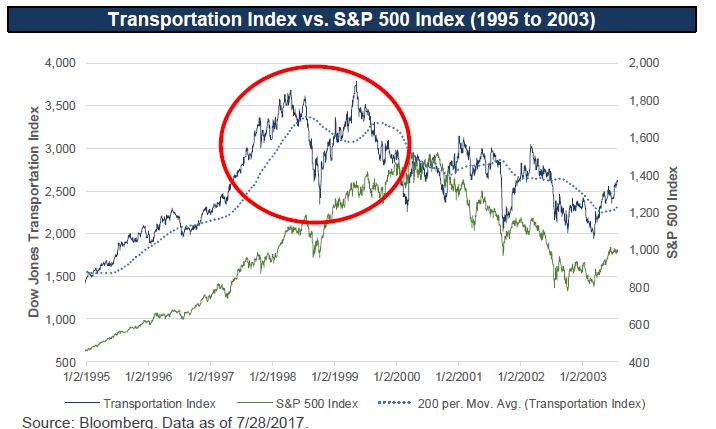
 The chart above shows how the Transportation Index lead before the dot com bubble in the early 2000’s. It failed its 200-day moving average initially in 1998 and then broke again in 1999.
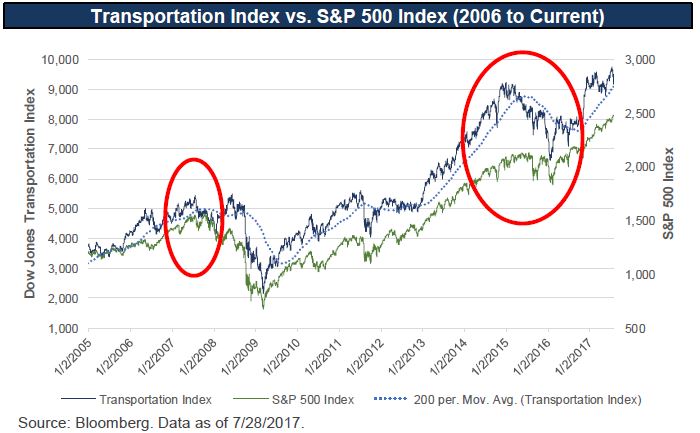
 The chart above shows how the Transportation index was a key leading indicator for the financial crisis of 2008 and also a key leading indicator into the turbulent equity markets in 2015 and 2016 that were congruent with the oil crisis.
Click here to download as a PDF.
The chart above shows how the Transportation index was a key leading indicator for the financial crisis of 2008 and also a key leading indicator into the turbulent equity markets in 2015 and 2016 that were congruent with the oil crisis.
Click here to download as a PDF.
 The chart above shows how the Transportation Index lead before the dot com bubble in the early 2000’s. It failed its 200-day moving average initially in 1998 and then broke again in 1999.
 The chart above shows how the Transportation index was a key leading indicator for the financial crisis of 2008 and also a key leading indicator into the turbulent equity markets in 2015 and 2016 that were congruent with the oil crisis.
Click here to download as a PDF.
The chart above shows how the Transportation index was a key leading indicator for the financial crisis of 2008 and also a key leading indicator into the turbulent equity markets in 2015 and 2016 that were congruent with the oil crisis.
Click here to download as a PDF.
Summary
- The Transportation Index has historically been a leading indicator for major moves in broader indices in the past decade.
- Saw some mixed earnings and weak guidance in transportation stocks for 2Q17.
- The Transportation Index began failing key technical levels at the end of 1998 and the beginning of 1999, a precursor to the dot com bubble.
- The Transportation Index began failing key technical levels at the end of 2007, a precursor to the Financial Crisis of 2008.
- Most recently, the Transportation Index failed its 200-day moving average in May of 2015, a precursor to the volatile summer of 2015 in the S&P 500 and through the lows of February 2016 with the oil crisis.
- Recently, the Transportation Index has fallen off its highs and is currently below its 50-day and 100-day moving average, with the 200-day moving average only 100pts below.
- We continue to watch this key index as a leading indicator for weakness in the broader equity markets.
Important Information
Leader Capital provides its thoughts on the current economy as well as analysis of specific market sectors and securities – and their strategy for the funds going forward. The securities and sectors mentioned are ones of interest to the portfolio managers in carrying out their investment strategy for the funds and although the funds may not invest directly in the securities or sectors discussed, their resulting performance may impact that of the funds – or influence actions taken by the portfolio managers. These discussions do not imply a recommendation to purchase any specific investment or investment in a specific market segment.
S&P 500 Index: Standard and Poor’s 500 Index is a capitalization-weighted index of 500 stocks. The index is designed to measure performance of the broad domestic economy through changes in the aggregate market value of 500 stocks representing all major industries. The index was developed with a base level of 10 for the 1941-43 base period.
Dow Jones Transportation Index: The Dow Jones Transportation Average is a price-weighted average of 20 U.S. transportation stocks. The average as it is known today began on October 26, 1896. It was formerly known as the Dow Jones Railroad Average.
Moving Average Convergence Divergence (“MACD”): Moving average convergence divergence (MACD) is a trend-following momentum indicator that shows the relationship between two moving averages of prices. The MACD is calculated by subtracting the 26-day exponential moving average (EMA) from the 12-day EMA.It is not possible to invest directly in an index.As of 7/28/2017 none of the securities referenced are currently held by the funds. Portfolio holdings and allocations may change at any time.
Past performance is not a guide to future performance. The information in this article does not qualify as an investment recommendation.
Risks: Investments in debt securities typically decrease in value when interest rates rise. The risk is actually greater for longer term debt securities. Investment in lower-rated and nonrated securities presents a greater risk of loss of principle and interest than higher-rated securities. Investments exposed to credit risk where lower-rated securities have a higher risk of defaulting on obligations. Investments in foreign securities involve greater volatility and political, economic and currency risks. They may also have different accounting methods. Investments in asset-backed and mortgage-backed securities include additional risks that investors should be aware of such as credit risk, prepayment risk, possible illiquidity and default, as well as increased susceptibility to adverse economic developments.
Investors should consider the investment objective, risks, charges and expenses of the Fund carefully before investing. The Prospectus contains this and other important information about the Fund. For a current Prospectus, call 800-269-8810 or go to www.leadercapital.com. Please read carefully before investing.
Foreside Distribution Services, LP.
Ref#87640