2020 OUTLOOK
- Inflation
- Volatility
- Recommendations
- Politics
- Market Calls
We see a lower dollar going forward, which should drive inflation higher. All commodities are traded in dollars and therefore a lower dollar could translate into higher commodity prices. Higher budget deficits ($1.5 trillion) could begin to exacerbate a lower dollar. Gold could rally as emerging markets continue to see currency devaluation, both deliberate and reflective.
II. Volatility VIX Range of 8 to 50. We see volatility going into 2020 as uncertainty pervades in this optimistic bull market. The trade war is far from over and the election could add a layer of added uncertainty as the democratic party narrows in on their top candidate. While we see no fundamental issues currently (unemployment at lows and no surprises within corporate earnings), we recognize this recent push higher in the markets has been fueled almost entirely by low interest rates. The election and inflation should be a big worry for the markets. The Federal Reserve will be in a tough spot as GDP Deflator could cruise past 2%. We currently believe that President Trump will be re-elected, but it will be contentious.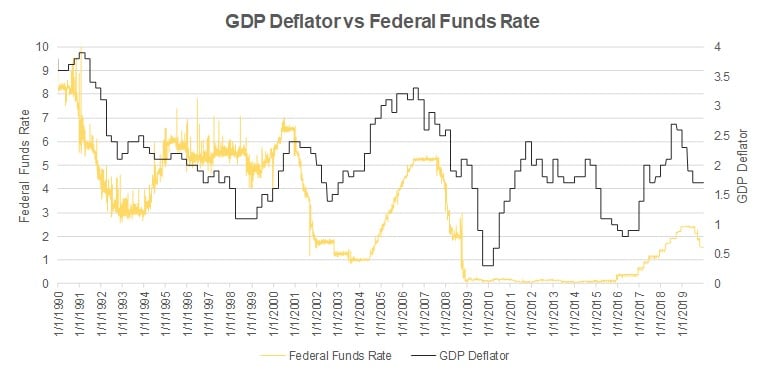
The repo market has spurred the Federal Reserve to start another round of stimulus, which should be a cause for concern as well. Shorter term, the repo market has calmed due to the intervention of the Federal Reserve. Longer term, the repo market is brittle, and we see major dampening of liquidity in that market, which could cause an implosion. There is too much leverage in the system from alternative players ($4.8 trillion). Leverage can be as high 20 to 1 in the repo market. We believe the Federal Reserve will redo the parameters of the repo market after an implosion.
III. Recommendations Winners:- Commodities
- Technology
- Floating Rate Bonds
- Emerging Markets
- Long Bond
- The disparity between a good borrower and bad borrower will widen. Certain high yield credits have been masked by low interest rates and bad covenants will come to light.
The political venue is polarized. From a financial view it is simple: Trump is better for the markets as the Democratic platform means more taxes and a slowing of money supply. As the two sides ebb and flow, we see volatility in the markets. It is our view that the economy is healthy and the current deregulation and extraordinary fiscal and monetary policy not only in the U.S. but globally will continue to drive markets higher. We see the key risk as inflation or parabolic markets; the Federal Reserve/Central Banks beginning to raise rates is the canary in the coal mine.
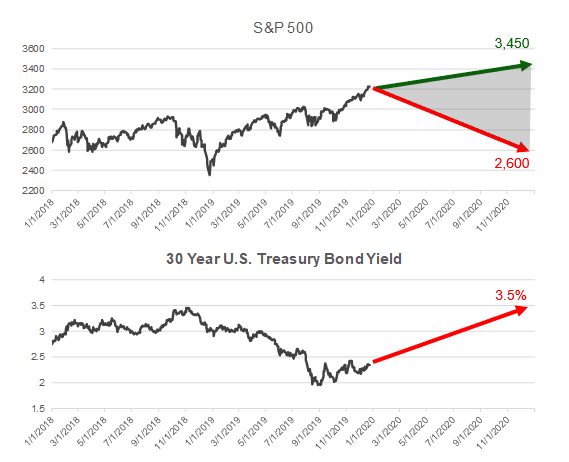
V. Market Calls S&P 500: Range of 2600 to 3450. 2950 represents a -20.0% downside (200-Week moving average) while the 3450 represents a +7.5% gain. We see a volatile year. These ranges will match a VIX jumping as high as 50 and as low as 8.30-Year Bond: 30-year bond could test November 2018 highs of 3.50% (steepening of the yield curve)