SpaceX – Possible Market Sell-Off
Slavik Kolesnik – Portfolio Manager
June 5th, 2026
Markets entered 2026 expecting a series of Federal Reserve rate cuts. Instead, we are seeing a landscape that has been consistent with our outlook for the past several years: inflation remains elevated, economic growth is slowing, and the Federal Reserve has limited flexibility to move policy meaningfully in either direction.
Real GDP growth has decelerated to 2.6% year-over-year, while Core PCE inflation remains at 3.3%—well above the Federal Reserve’s 2% target. Headline PCE has risen to 3.8%, its highest level in three years, driven in part by supply disruptions in the Middle East. Inflation continues to outpace economic growth, a trend that began in mid-2025 and has yet to reverse.
GDP Growth vs. PCE Inflation (Year-Over-Year)
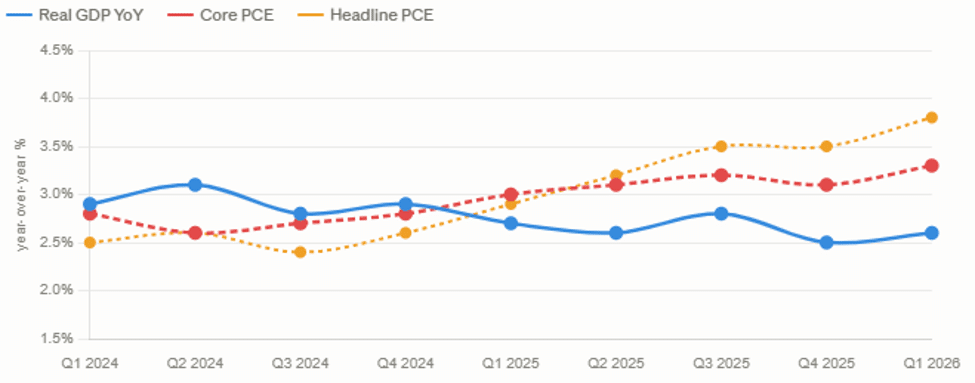
Sources: Real GDP YoY — Bureau of Economic Analysis (BEA), Q1 2026 advance estimate. Core PCE & Headline PCE — Bureau of Economic Analysis, Personal Income and Outlays release, April 2026.
The inflection point occurred during the second and third quarters of 2025, when inflation surpassed GDP growth. Today, the spread stands at approximately 70 basis points using Core PCE and 120 basis points using Headline PCE, indicating that inflation is consistently outrunning economic expansion.
The U.S. consumer, which accounts for roughly two-thirds of GDP, is showing increasing signs of strain. Retail sales growth slowed sharply to 0.5% in April, down from 1.7% in March. Credit card balances have reached a record of approximately $1.33 trillion, with many consumers paying interest rates between 15% and 19%. Meanwhile, the personal savings rate has fallen to just 2.6%, highlighting growing pressure on household finances.
The primary risks we are monitoring today are credit quality and AI-related valuations—not private credit.
We believe the anticipated SpaceX IPO, expected on June 12 at an estimated $1.77 trillion valuation, could represent a defining moment for this market cycle. If completed at that valuation, it would become the largest public offering in history and would represent approximately 5% of the entire Nasdaq market capitalization in a single listing. Historically, periods characterized by this level of investor enthusiasm and concentration have often occurred near market peaks rather than at the beginning of new cycles.
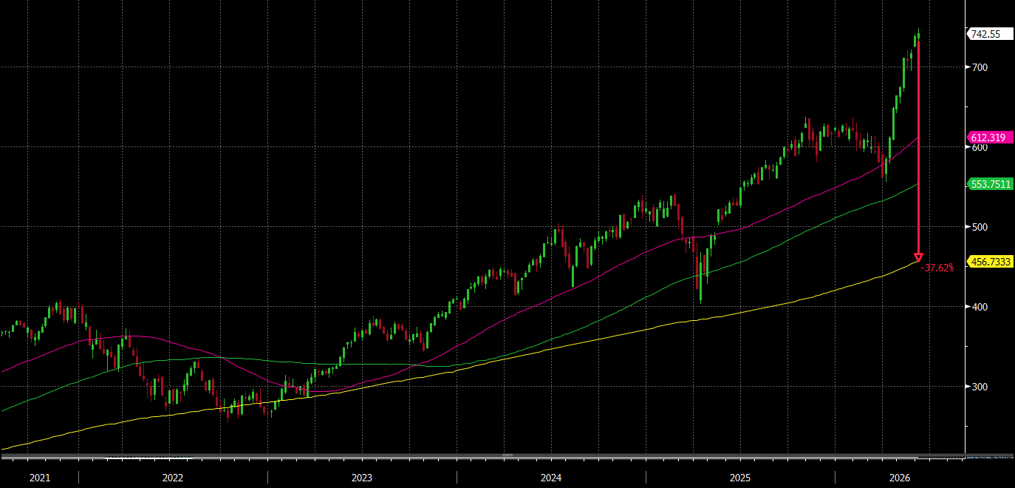
More broadly, AI-related companies have generated more than $19 trillion in market capitalization gains since late 2022, while actual infrastructure investment associated with the AI buildout has totaled approximately $2 trillion. With the Nasdaq currently valued at approximately $36 trillion, we believe a meaningful reassessment of AI-related valuations could expose the Nasdaq market to a significant correction, with the QQQ index testing its 200-week moving average.
QQQ Index Prediction
Looking ahead, the path of inflation, Federal Reserve communication, and labor market conditions will be critical. Depending on June and July inflation data, future Fed guidance, and the trajectory of U3 unemployment, rate hikes can no longer be dismissed as an impossibility.
In this environment, our High Quality Fund will remain tightly positioned. Our High Yield Fund remains fully invested with low-duration investments.
Sources: Real GDP YoY — Bureau of Economic Analysis (BEA), Q1 2026 advance estimate. Core PCE & Headline PCE — Bureau of Economic Analysis, Personal Income and Outlays release, April 2026. Retail sales grew 0.5% in April (Census Bureau), decelerating from 1.6% in March. Credit card balances hit a record $1.28 trillion in Q4 2025 (Federal Reserve Bank of New York), with average APRs at 21% (Federal Reserve). The personal savings rate has fallen to 4.0%, down from 6.2% in early 2024 (Bureau of Economic Analysis).
For Financial Professional Use Only – Email not for Public Distribution Source:
Investing in any mutual fund involves risk, including loss of principal. The risks specific to the Leader Funds are listed on the attached Fact sheets and detailed in the prospectuses for the funds. There is no guarantee the funds will achieve their objectives. Expense ratios are as of the 11/28/2025 Prospectus.
An investor should consider the Fund’s objectives, risks, charges, and expenses carefully before investing or sending money. This and other important information can be found in each Fund’s prospectus. For more information, please call 1-800-269-8810.
Please read the prospectus carefully before investing.
Current Yield is the weighted average of the annual rate of return based on price. It is calculated by the coupon divided by the price. Average Yield-to-Maturity is the weighted average of the percentage rate of return if the security is held to maturity. Leader Capital Corp. serves as adviser to Leader Short Term High Yield Bond Fund, and Leader High Quality Income Fund, The Funds are distributed by Matrix 360 Distributors, LLC, Member FINRA/SIPC. Leader Capital and Matrix 360 are not affiliated.
Past performance does not guarantee future results. The performance data quoted represents past performance and current returns may be lower or higher. Share prices and investment returns fluctuate and investor shares may be worth more or less than the original cost upon redemption. To obtain performance as of the most recent month-end, please call 1-800-269-8810.